Monday 28 September
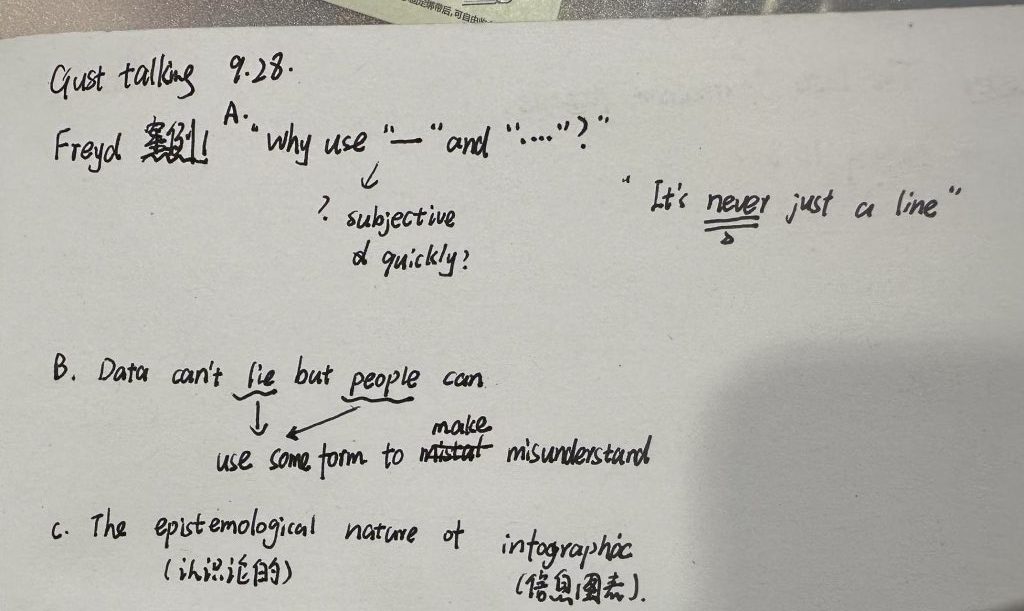
Guest Lecture: Gabi Schaffizin
When is a line more than just a line?
The evolution of the presentation of emotional information across social, technological and historical dimensions
This explores our audience, the context of our work, the labour involved, the sources of data, how data is collected and processed, what we have omitted and what we have included, and—crucially—how we guide the audience to experience an emotional connection throughout the process.
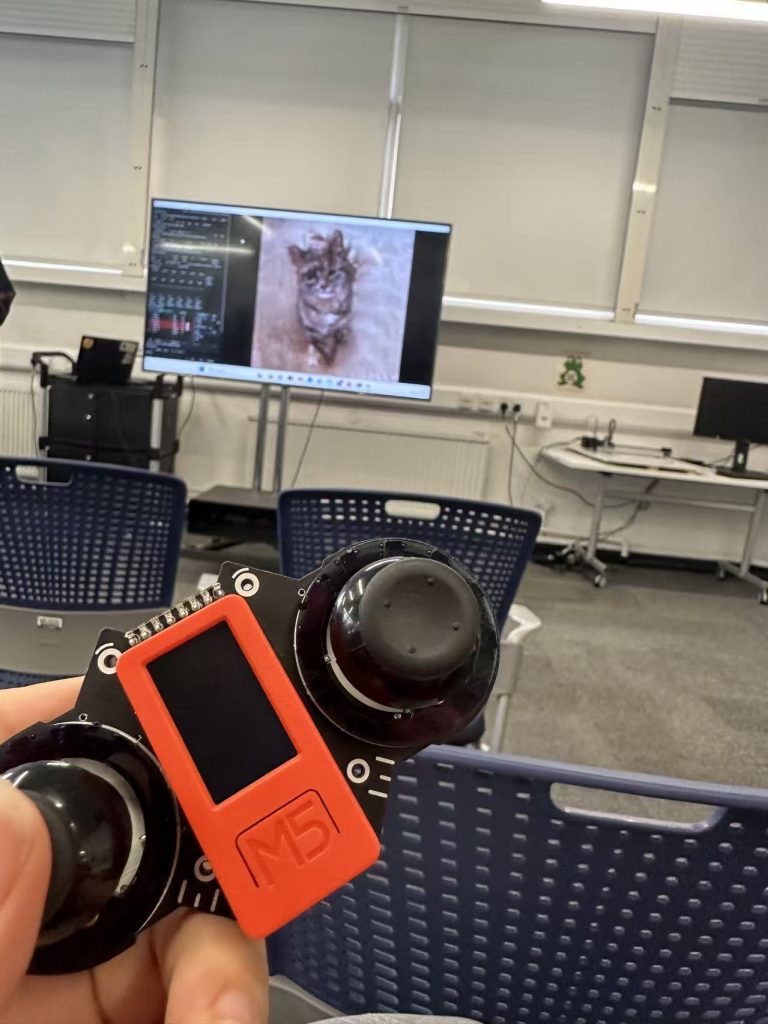
Digital Space | Digital Space Induction Creative Technology Lab | Creative Technology Lab Induction | Dolica Akello-Egwel
Tuesday 29 September
Language Development
I found the course, which guided us through the literature whilst focusing on key points and difficult concepts, to be very useful, and the lecturer was also quite entertaining. The course focused on the core concepts of feminist data visualisation.
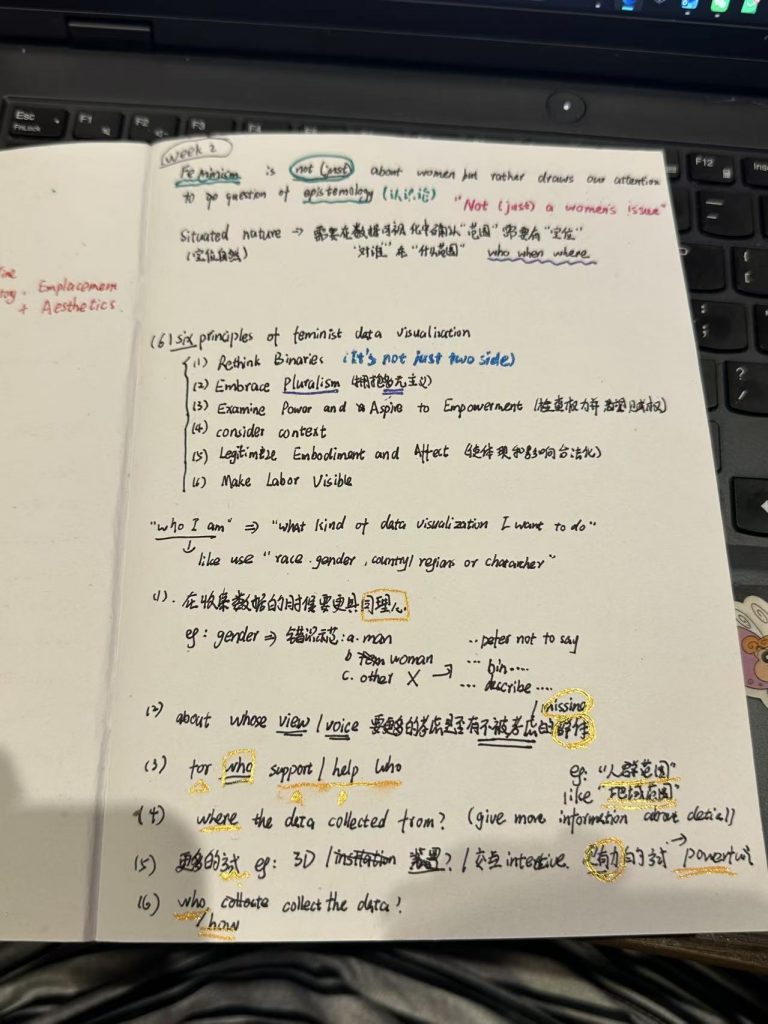
Data Visualisation Research and Practices | Sheran Forbes and Sara Fiorillo
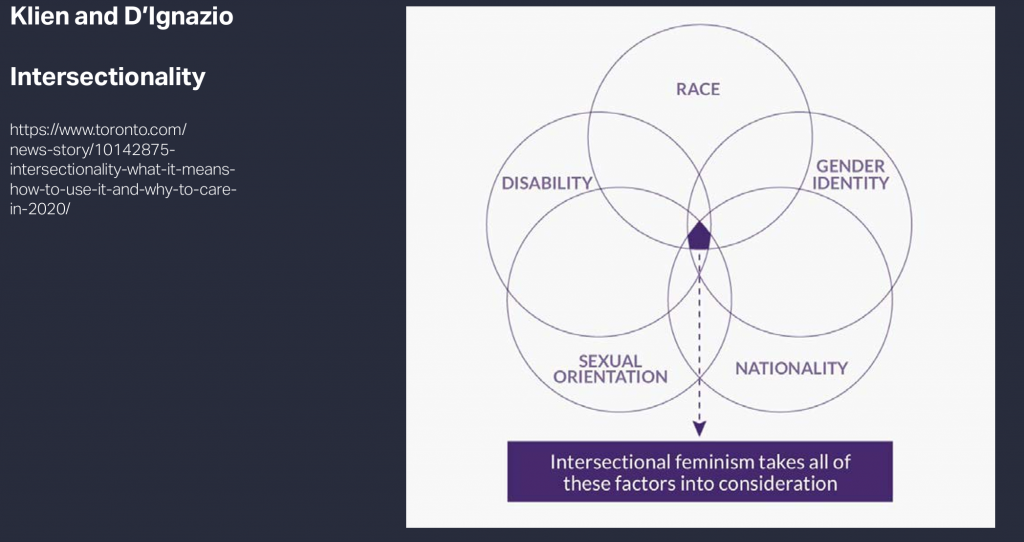
Feminist data visualisation is an interdisciplinary field
The guest speaker showcased numerous real-world applications of data visualisation in the news media, presented many interesting case studies, suggested ways to make serious data visualisation more engaging, and introduced a range of practical tools.
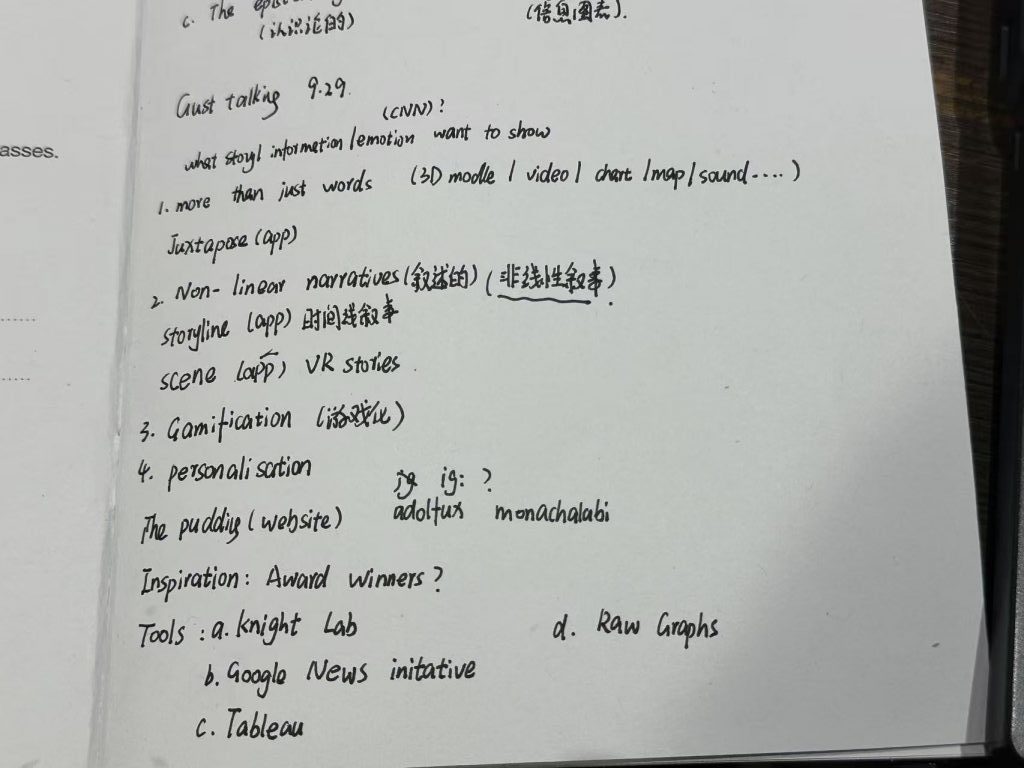
Wednesday 30 September
Visualisation Tools, Datasets and Data Stories
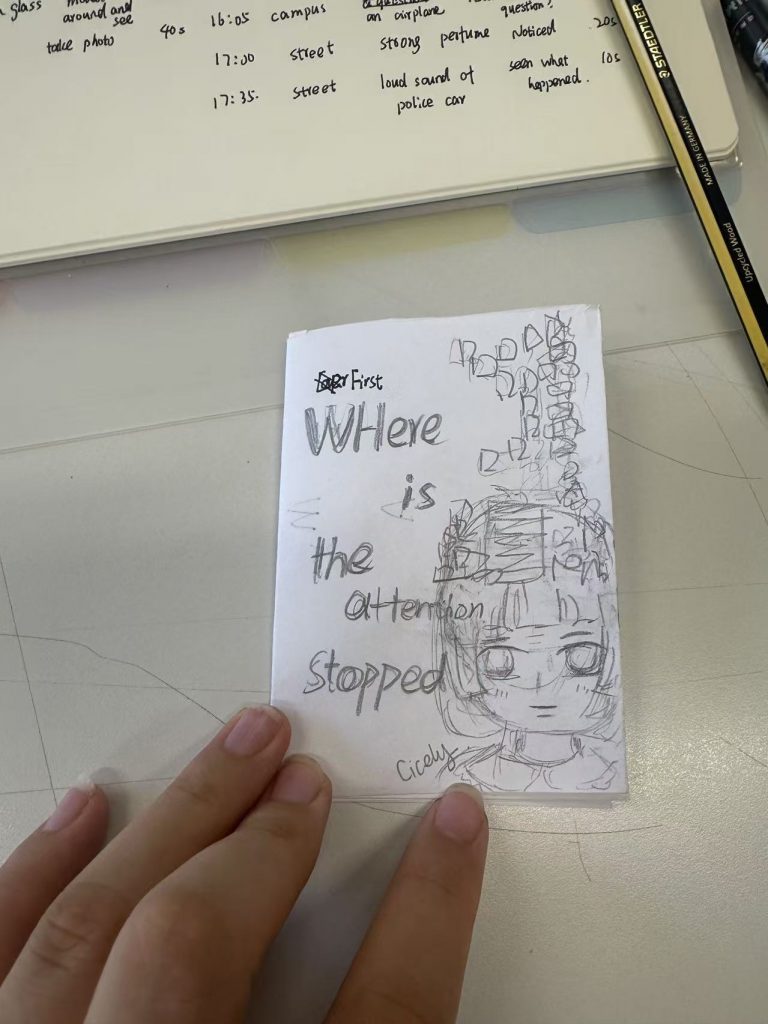
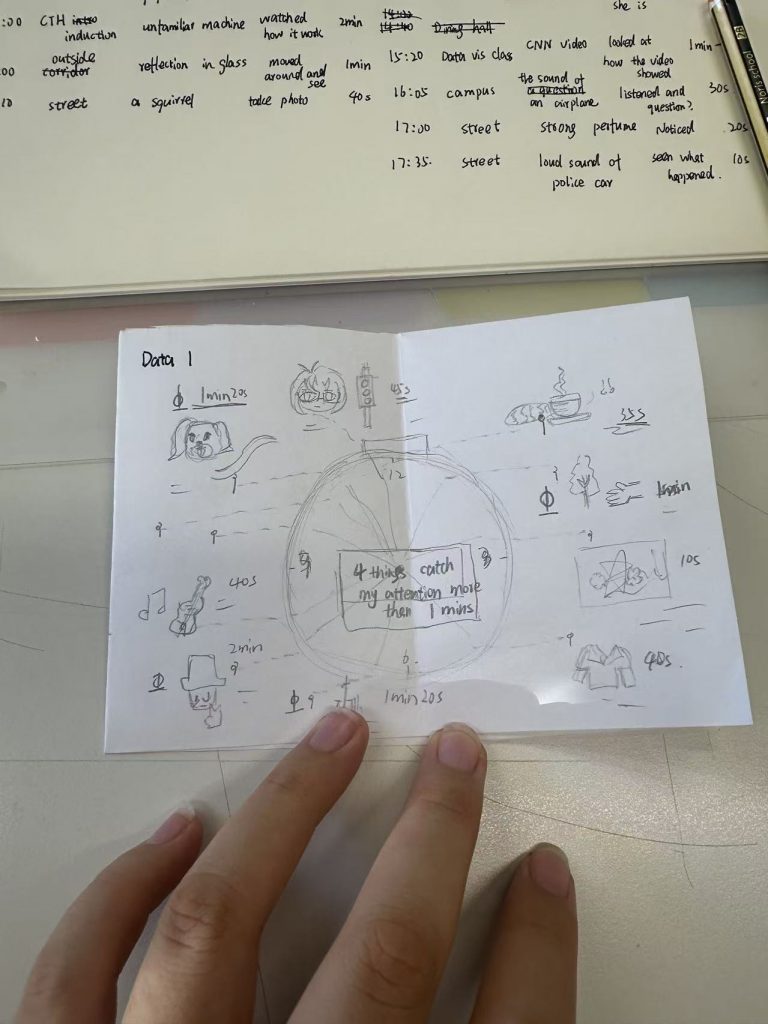
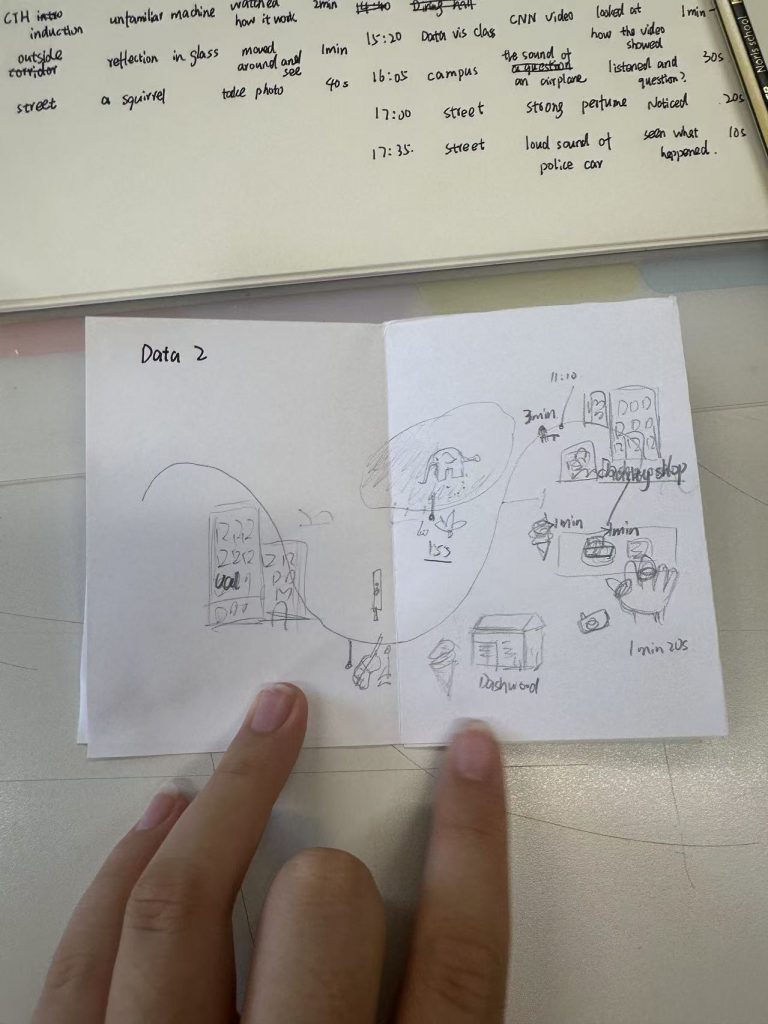
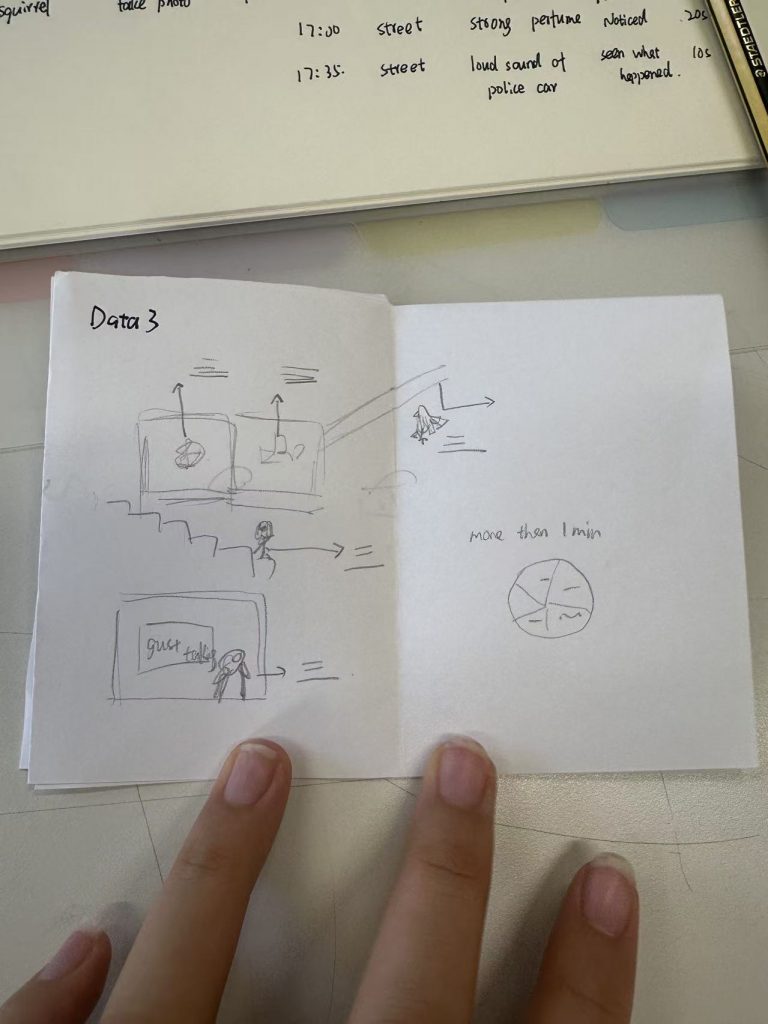
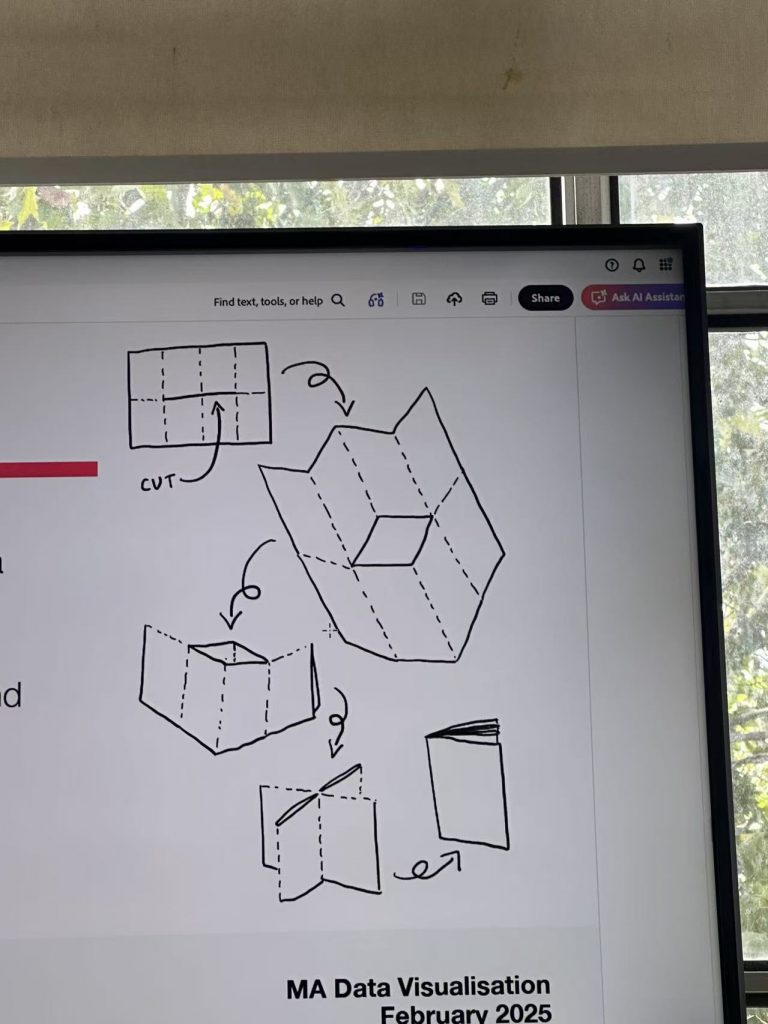
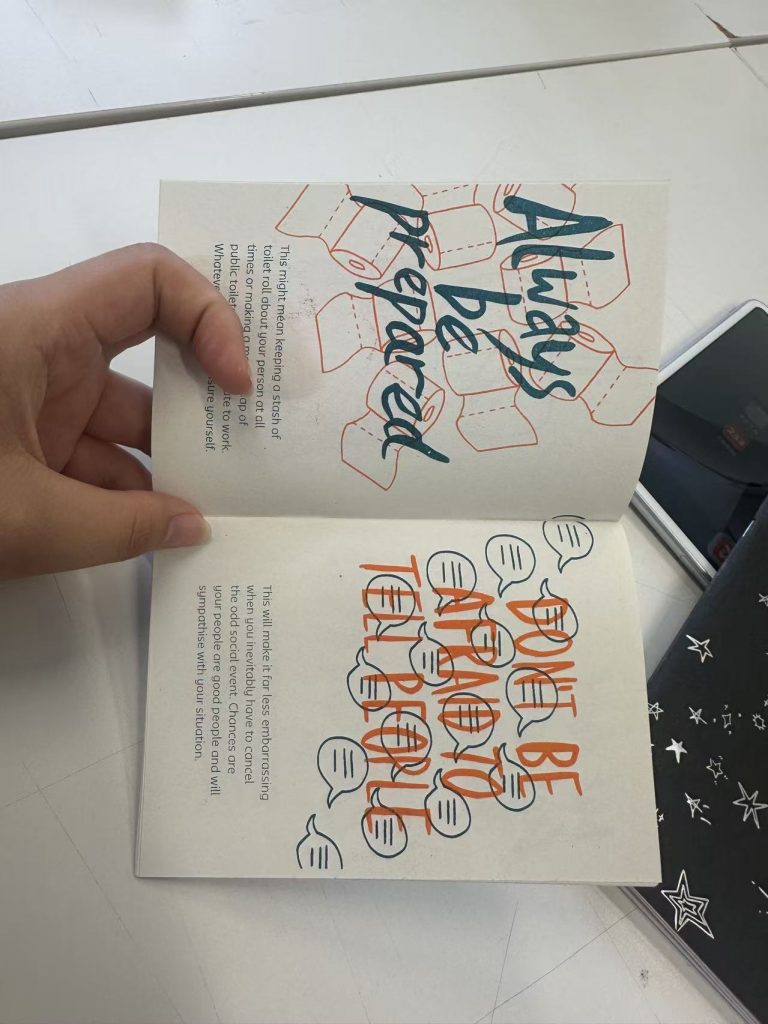
Learning how to make a zine: thinking about content creation – how to visualise the data you’ve collected
Shan and emma gave me a lot of advice on how to refine my draft further and to think more carefully about whether the audience would be able to understand the data visualisation easily.
Thursday 1 October
Visualisation Tools, Datasets and Data Stories
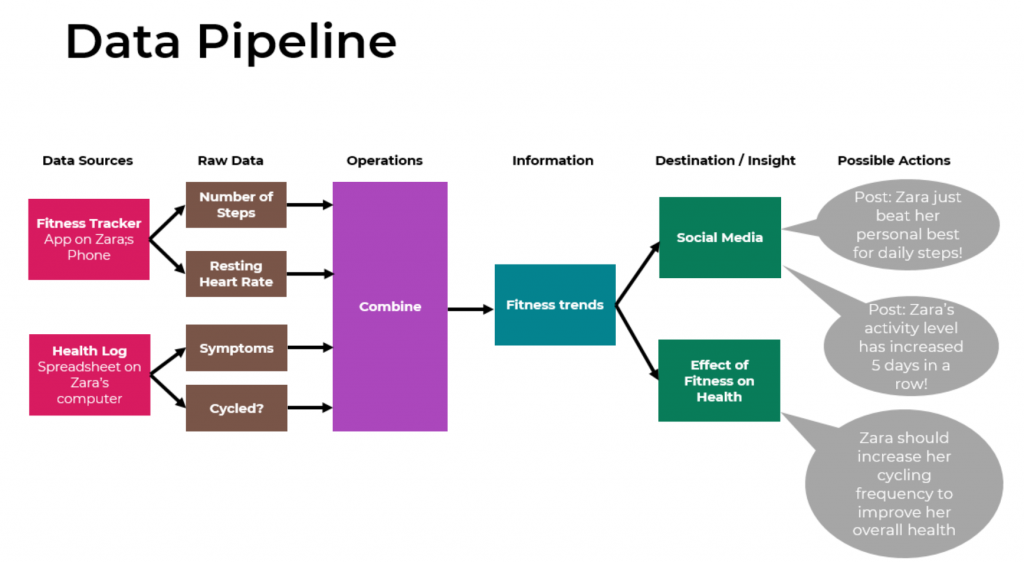
Learn how to extract raw data from data sources, transform it into information, and build a data pipeline。Learn how to organise data using Excel
eg:analyse zara’s data
Leave a Reply