Visualisation Tools, Datasets and Data Stories
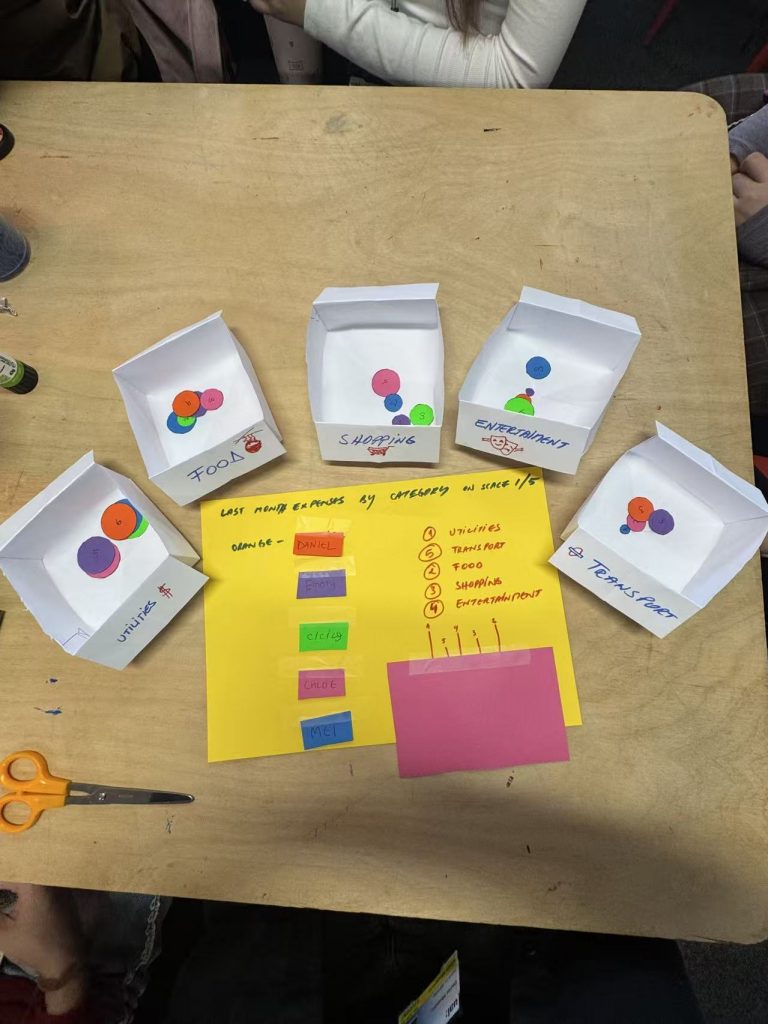
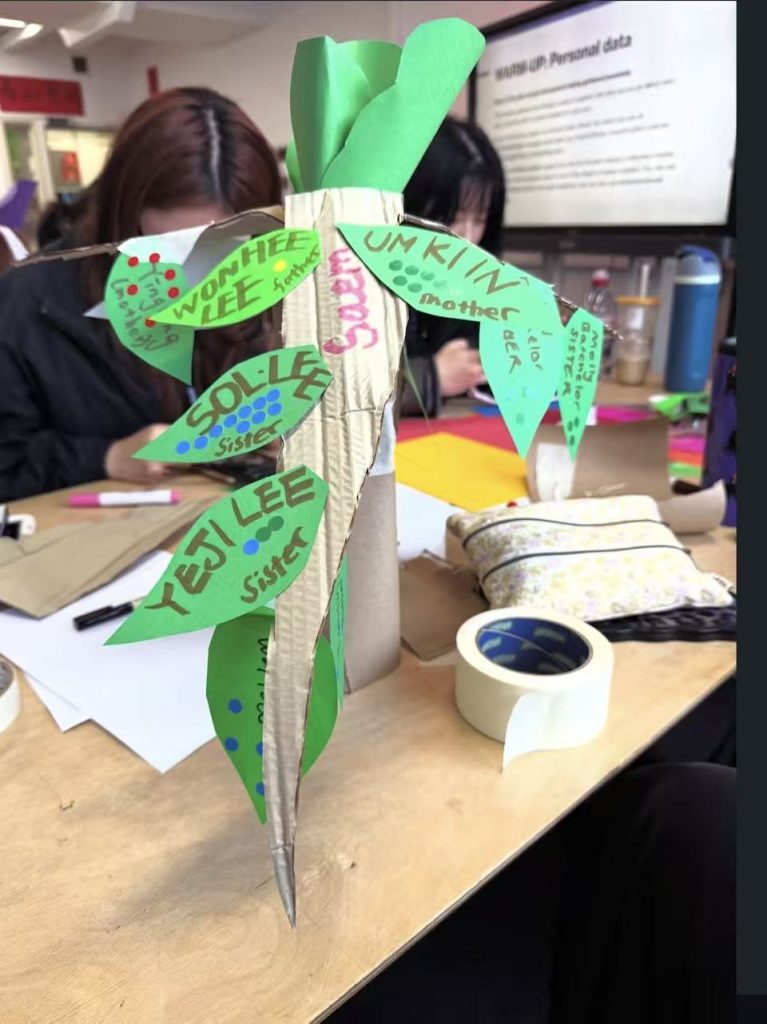
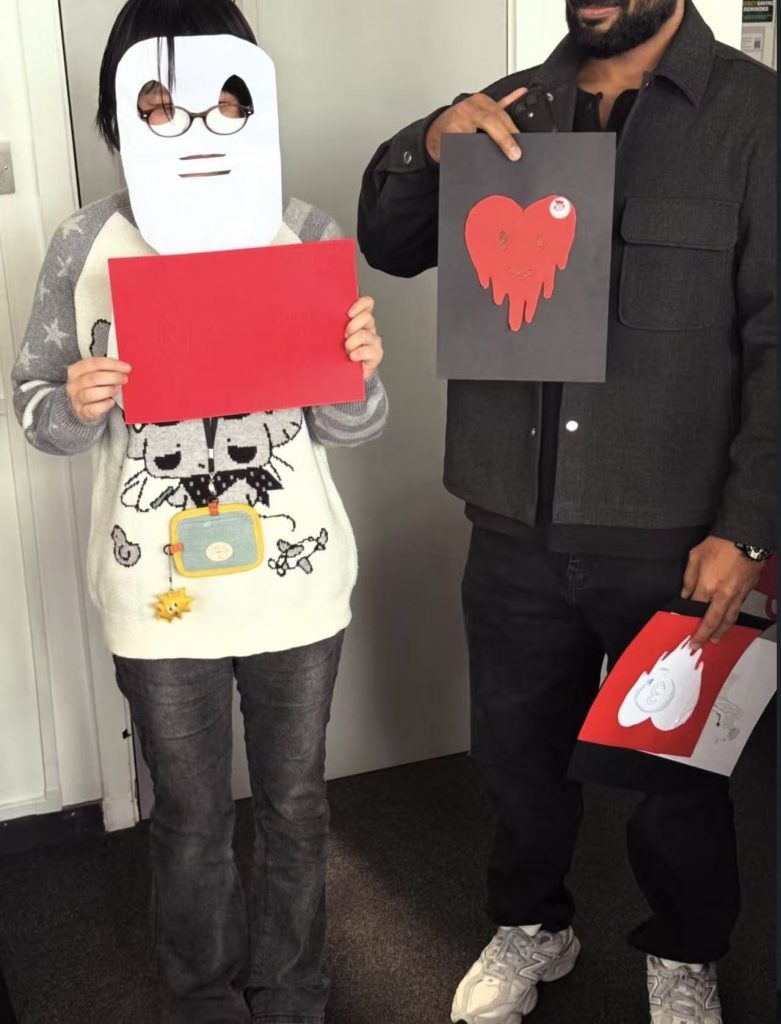
It was a particularly interesting group collaboration. Working with the UX students was a real pleasure, and I learnt a great deal from them—such as their focus on the needs of the target audience and their consideration of the overall design. It was truly a process of mutual learning. Thinking from a non-human perspective also gave me a fresh outlook on the world, and made me realise how we sometimes overlook certain people in the process of data visualisation.

Tuesday 13 October
Language Development
Data Visualisation Research and Practices
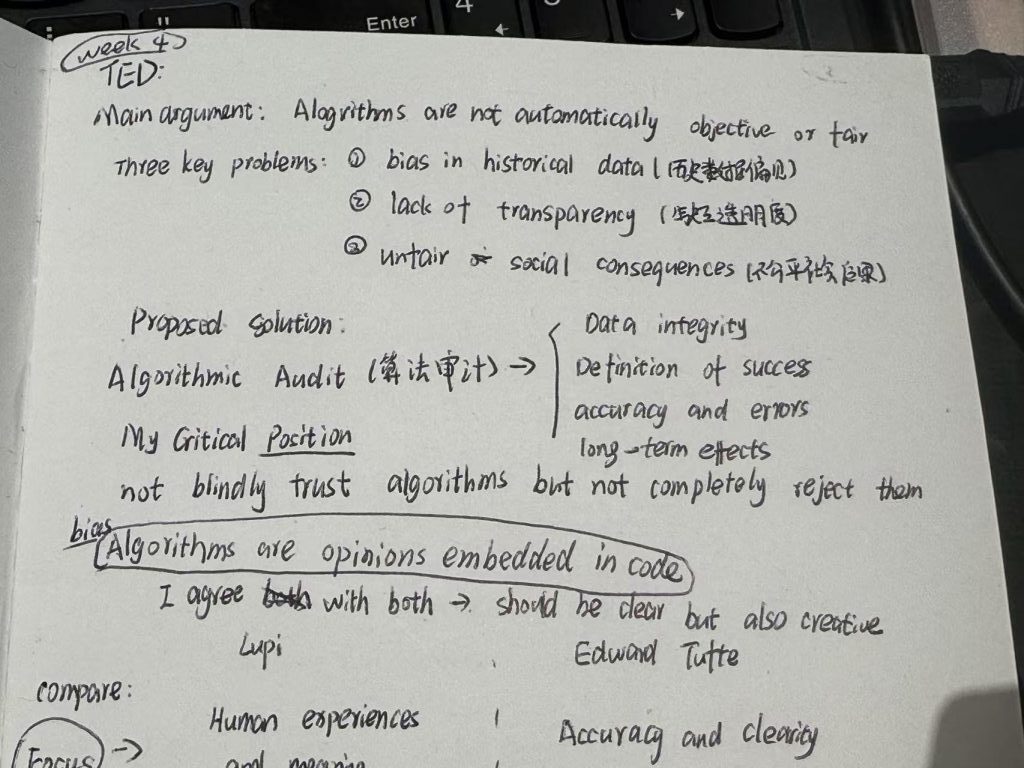
/
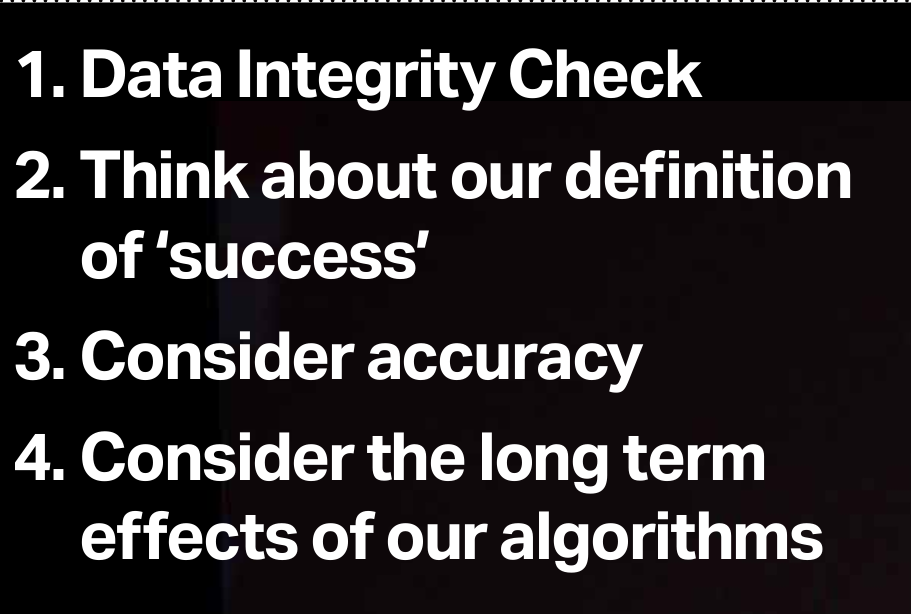
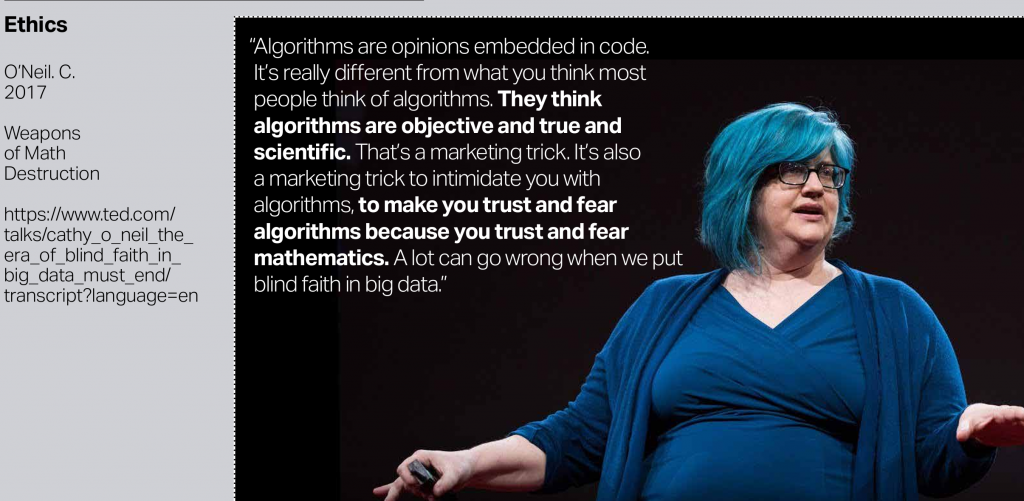
“ One of the challenges, we have encountered exploring this area of concern (AI ethics & AI’s impact on society) is the role that the media and movies has played in the mainstream amplification of potential and current problems associated with AI.” Alex Fefegha
Thursday 15 October
Visualisation Tools, Datasets and Data Stories
Distinguish between qualitative and quantitative data, and learn how to create different types of trend charts
Learn how to calculate percentages using Excel
Filter using the funnel tool
Leave a Reply