9.22(Tuesday) research and practice
Coursework Requirements
about essay:
Drawing on both key discussions within the field as
well as examples of practice, establish your critical and
informed position on what it means to be a responsible
designer in this discipline
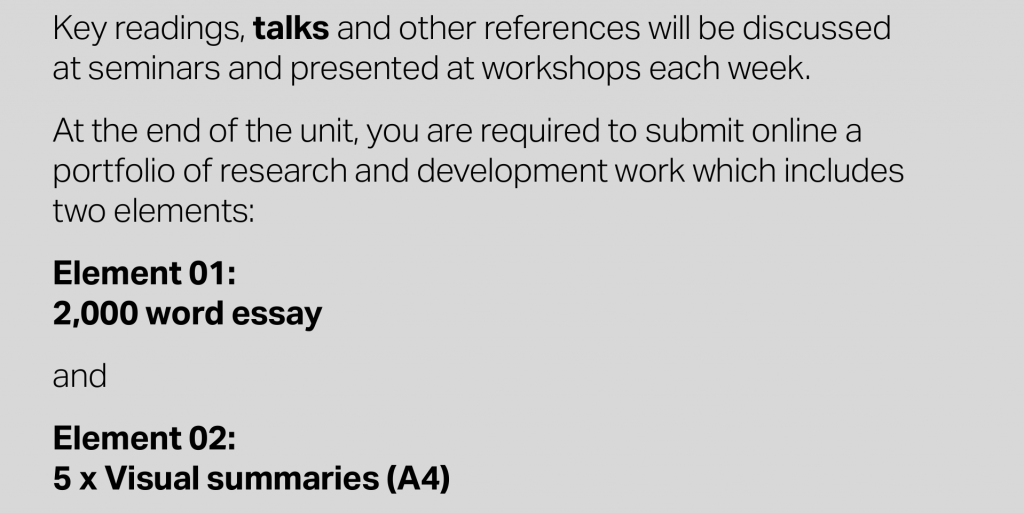
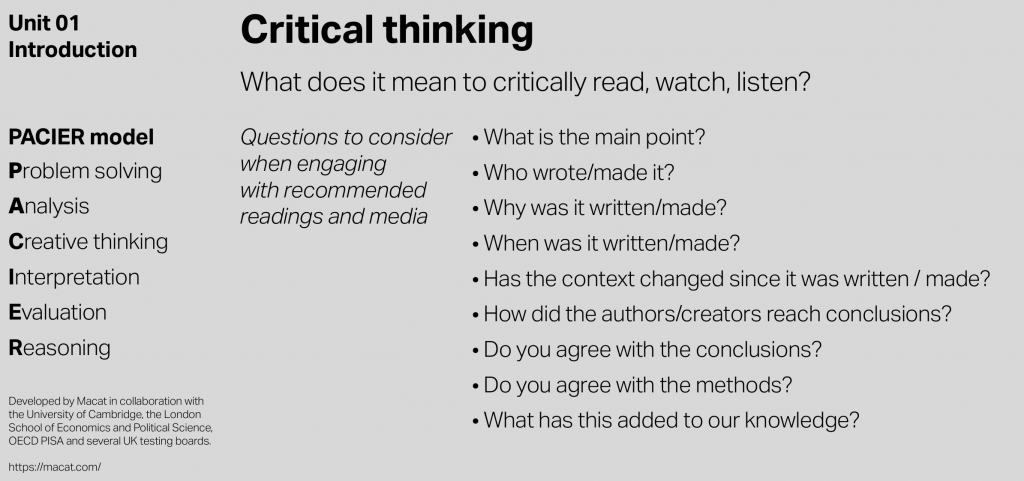
learn how to usePACIER and visual note
From Sheran’s explanation, I learnt that the key responsibilities in the principles of good data visualisation comprise two aspects: Functionality (1. Tell a story; 2. Be accurate; 3. Be intuitive) and Representation (1. Explain data; 2. Explore data; 3. Discover and create new knowledge).
Emerging frameworks, future challenges, and the potential of
data visualisation 1,Social justice2. Feminist studies 3.Big data 4.The quantified self

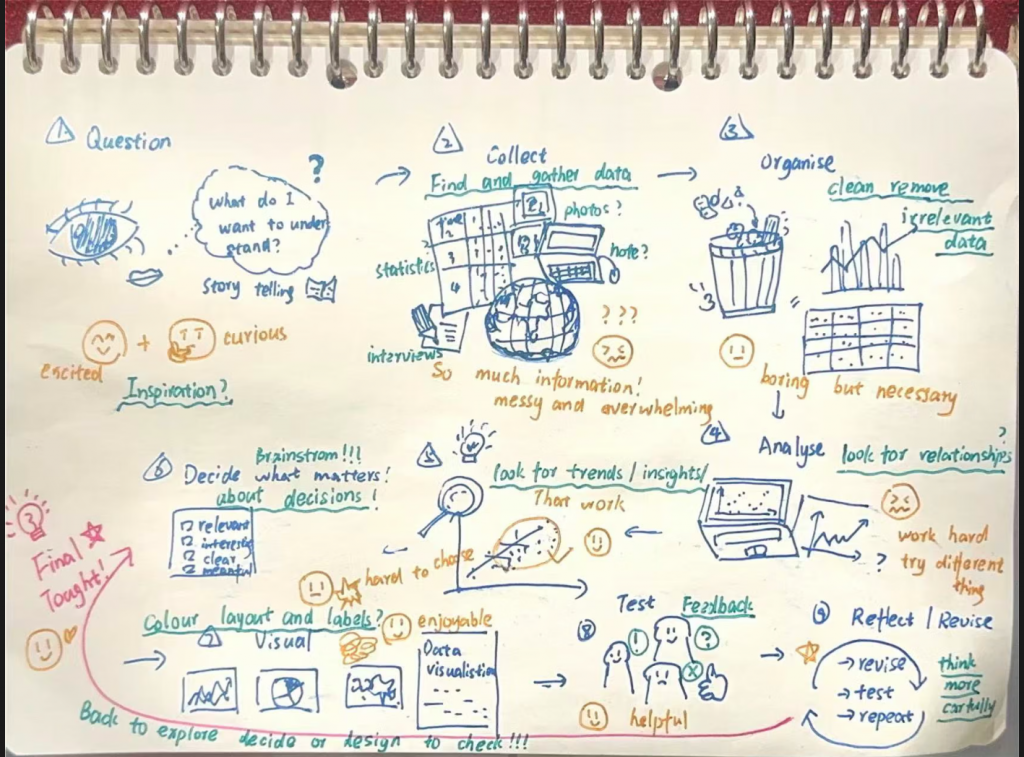
This is the first time I have systematically considered what the process of data visualisation actually entails, and how I should approach and think about it.
(A collaborative project with my classmates)
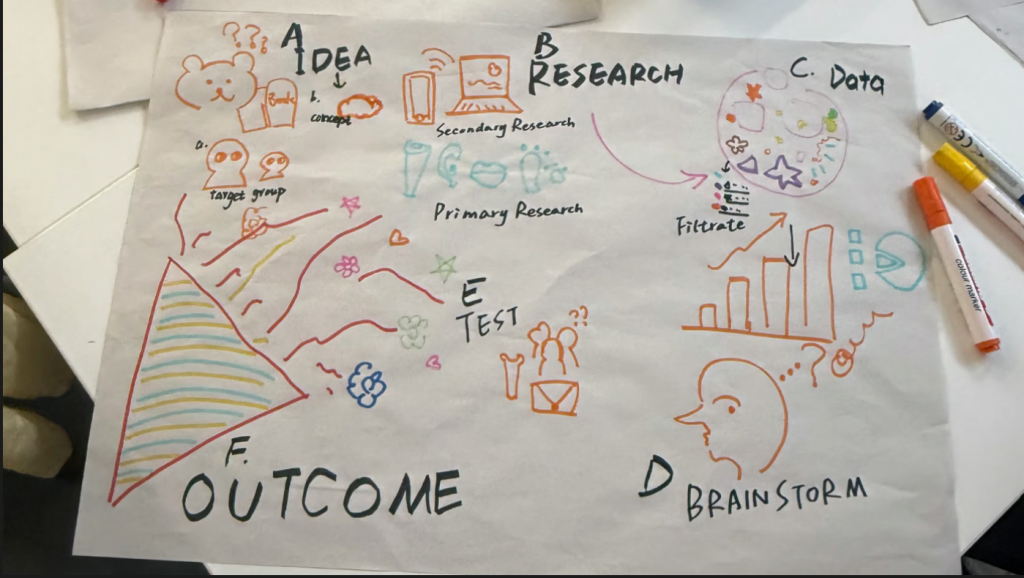
The result of more detailed reflection after the lesson
I have also looked at some visual content that I believe is effective or has no practical value, in an attempt to learn from its strengths and avoid its weaknesses.
Some key points from the original text
Concept of Data Visualization
1.“ A visualisation in its most general capacity provides a
medium of expression, through which information may be
presented or stated … after this the visualisation functions
as a medium to explore data.”– Steven Braun, Data Visualisation for Success
“ … information visualization and design are the
transformation of data into a visual narrative and
medium that can be expressed and interpreted in
different ways.” – Steven Braun, Data Visualisation for Succes
“ … color, size, and length, which are properties of visual
cues that are processed very quickly in the brain, and
suggests that paying particular attention to design
choices made with respect to these features and
how they unfold in visual working memory can greatly
enhance the quality of a good visualization.”- Colin Ware, Visual Thinking for Design
“ We expect a visualization to first and foremost
explain data to us, and any visualization that fails
to meet this most basic goal fails to serve as an
effective visualization. This function spans a range
of effectiveness, and as we become exposed to
many different types of visualizations with increasing
frequency, we become trained to identify when a
visualization has or has not explained the data behind
it effectively.”- Steven Braun, Data Visualisation for Success
“ visualization is effective when it enables us to touch,
move, or otherwise engage with data in ways that
would be impossible in other forms.”- Steven Braun, Data Visualisation for Success
“ … challenging our conceptions of authority, knowledge,
and their practical manifestations [of data] … raising
the question of what data itself means for how we
formulate our claims of truth.”- – Steven Braun, Data Visualisation for Success
“ Without data it would be very easy for
governments to tell their own story”
John Burn-Murdoch“
it holds the potential to change our
conceptions of perceived divisions
between disciplines, methodologies, and
ways of knowing. The major challenge
to the field in this respect, however, is
to leverage visualization effectively as a
medium for change.”- Steven Braun, Data Visualisation for Success
“ … wide availability of data about many
different aspects of society has made it
possible for advocates of social justice
to demand accountability of individuals,
political groups, social institutions, and the
government, inspiring new movements for
and expectations of openness.”- Steven Braun, Data Visualisation for Success
“ … adopts the feminist theory perspective that all
knowledge is socially situated … feminist studies offers
the unique advantages of providing a platform for
examining power structures manifest in visualizations
and inventing new ways to represent uncertainty
and ambiguity, represent the material economy
behind data, and make dissent possible. From this
perspective, knowledge is a constructed product,
and visualization becomes a constructed space in
which the terms of expression are negotiated between
designer and user.”- Steven Braun, Data Visualisation for Success
“ As more and more devices track data about
our daily behaviors, including our physical
activity, our locations, and our spending
habits, there has been an increased
appetite for ways to visualize the immense
quantities of data that are produced in the
process.””- Steven Braun, Data Visualisation for Success
“ … numbers, statistics but with an eye
towards creativity …a lot of those
decisions are editorial judgements that
don’t have a clean right or wrong answer.
We are balancing a rationale with some
personal choice.”- Andy Kirk
“ Elegant aesthetics are formed by a
recipe comprising astute colour choices,
layout decisions, typeface selection, and
interactive slickness. It intrigues the viewer,
inspires their curiosity, and invites them to
read and interact with the contents.”- Andy Kirk
“ It’s everything – it’s the way you experience
the world, it’s the way you experience your
life, it’s the way you experience the service.
Or, yeah, an app or a computer system. But
it’s a system that’s everything.”- Don Norman, pioneer and inventor of the term ‘user experience
“ We should be] thinking about the
experience of our graph.”- Andy Kirk
9.24(Thurday)Datasets and data stories
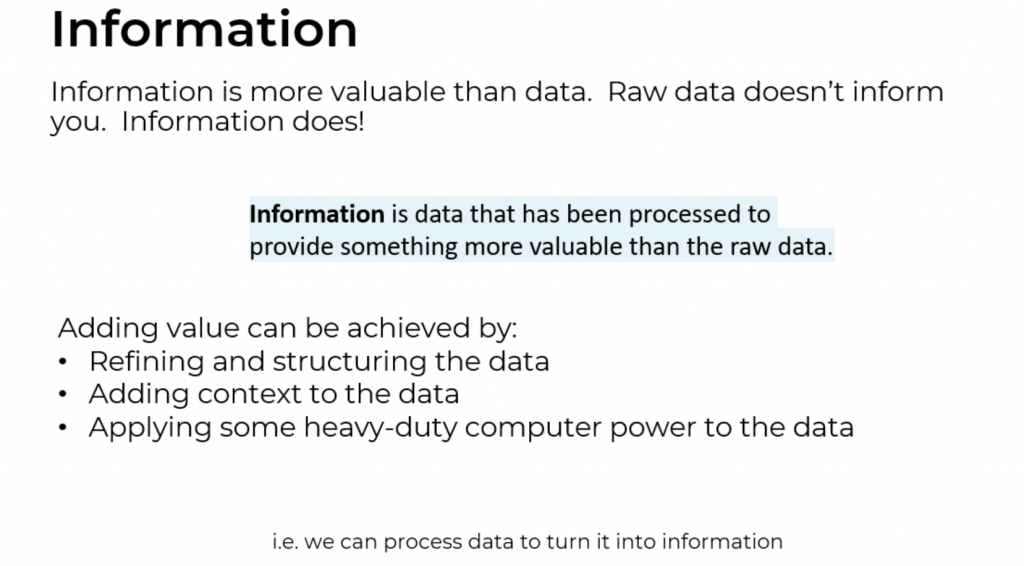
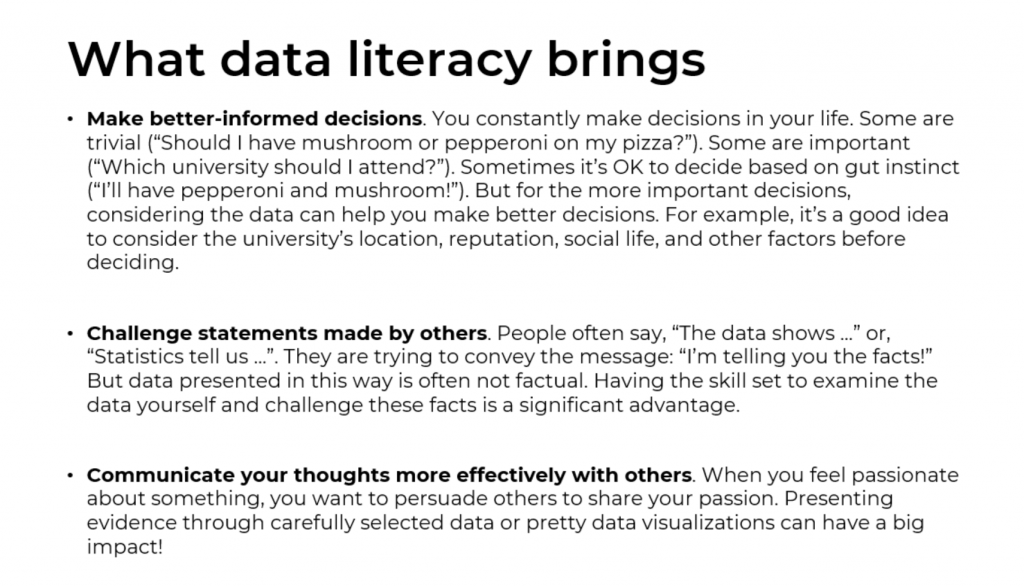
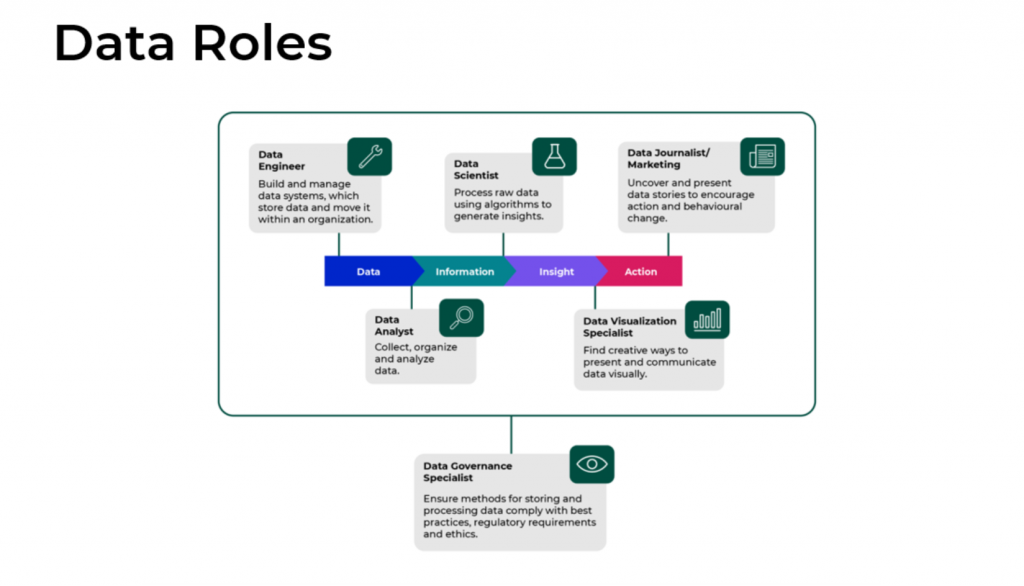
I have learnt about the relationship between data, information and action, and am trying to understand the concept of ‘insight’



9.25(Friday)Datasets and data stories
It was only when I gave serious thought to the concept of ‘myself’ and tried to express the details of my life through data visualisation that I realised how very close data visualisation can be to my own life.
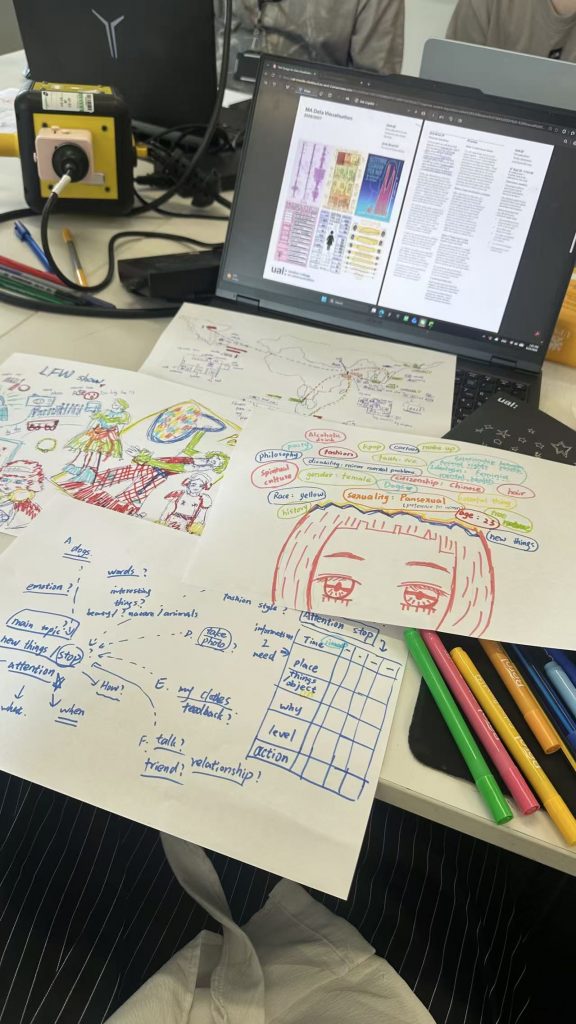
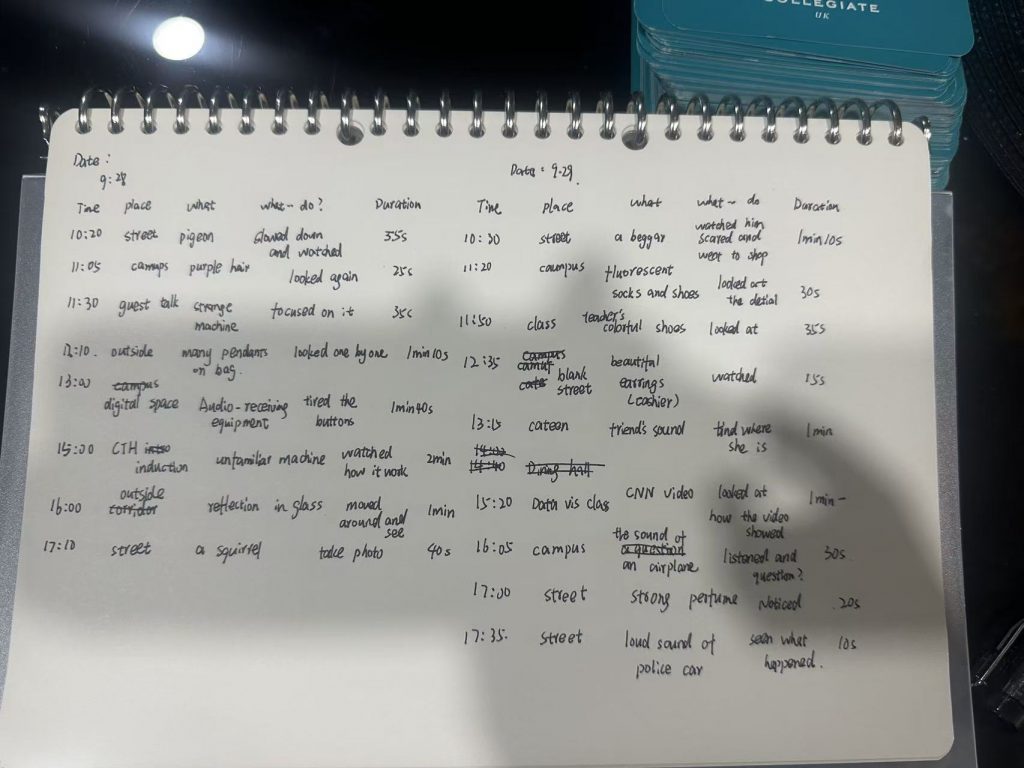
I decided that the theme of my first project would be ‘Where does my attention lie?’ and began collecting relevant data for analysis.


Leave a Reply