Monday 5 October
Visualisation Tools, Datasets and Data Stories
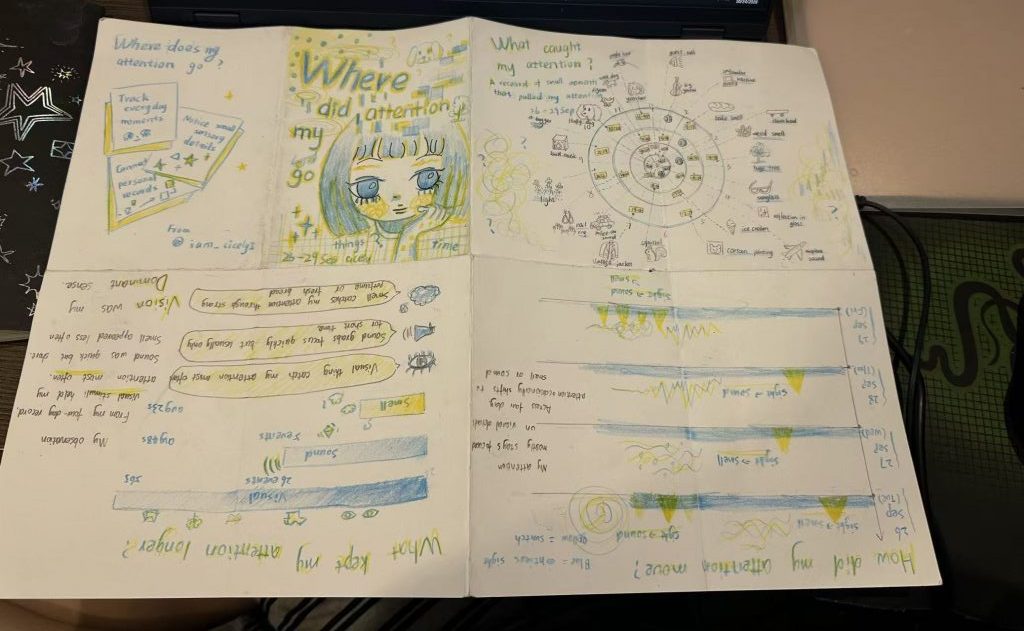
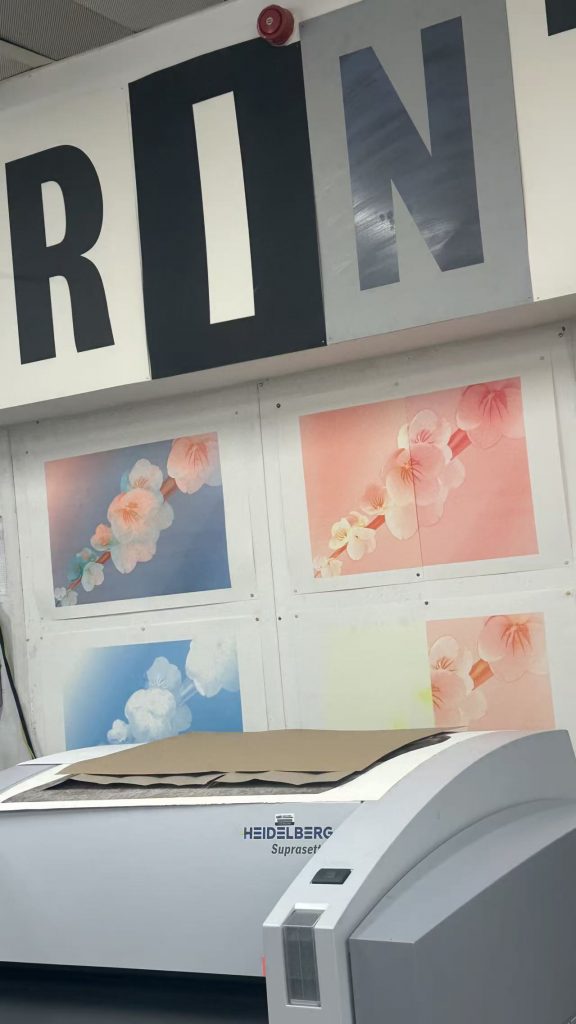
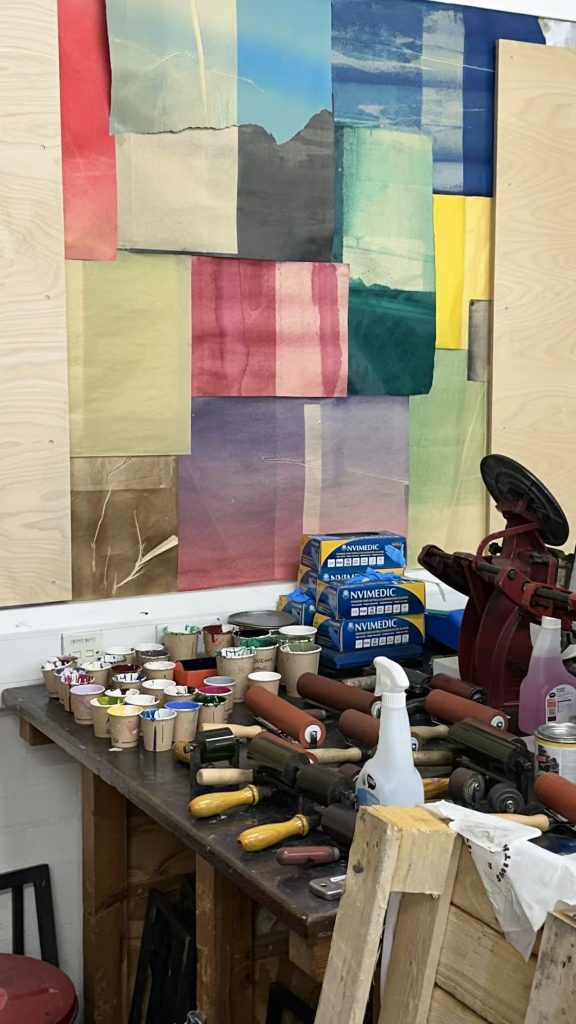
Having learnt about the principles of layered printing with the Riso machine and how to use it, I found it to be a very useful tool for visual design and printing. I also learnt about other printing techniques and feel that, given the opportunity, I would like to try screen printing. I drew a draft at the same size as the original.
Tuesday 6 October
Language Development
Data Visualisation Research and Practices
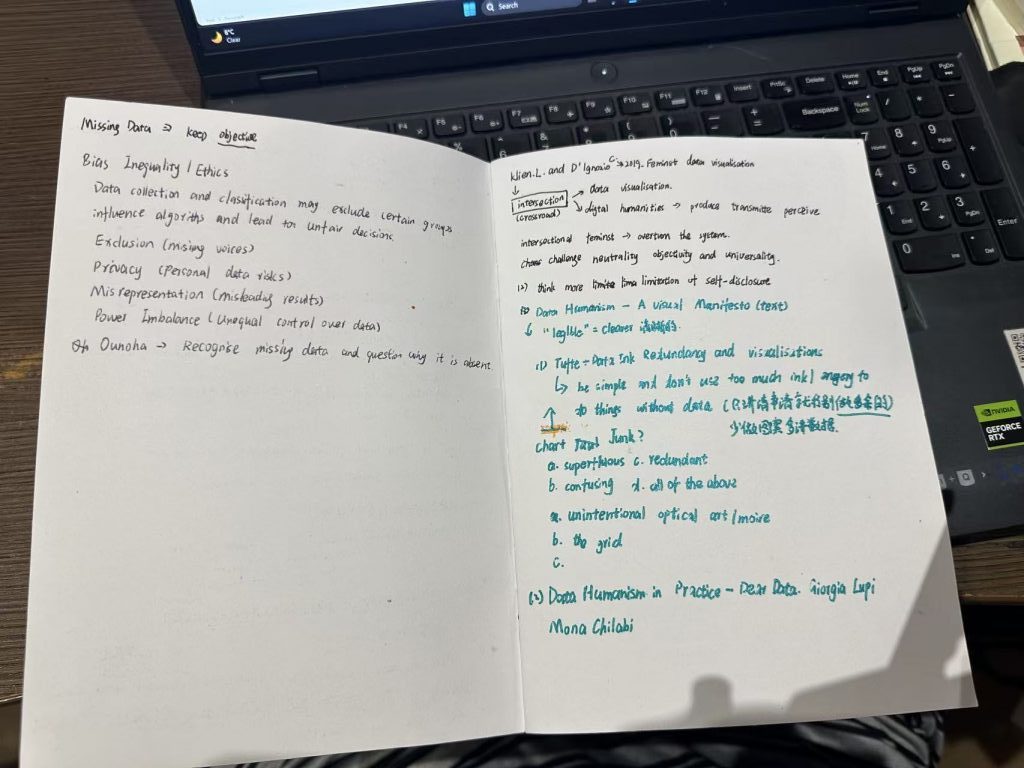
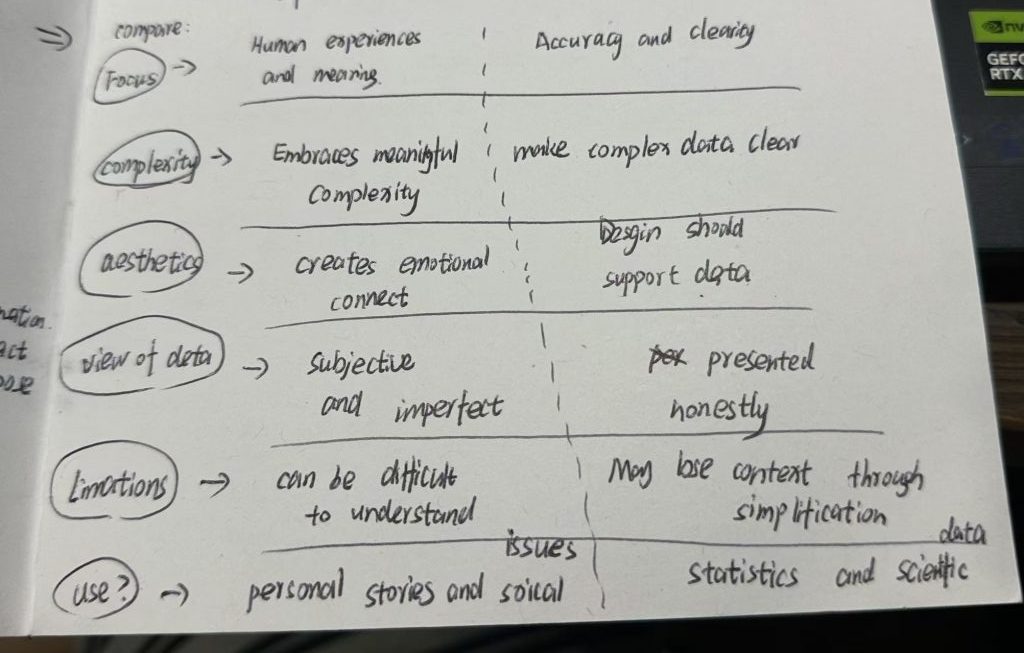
key text:
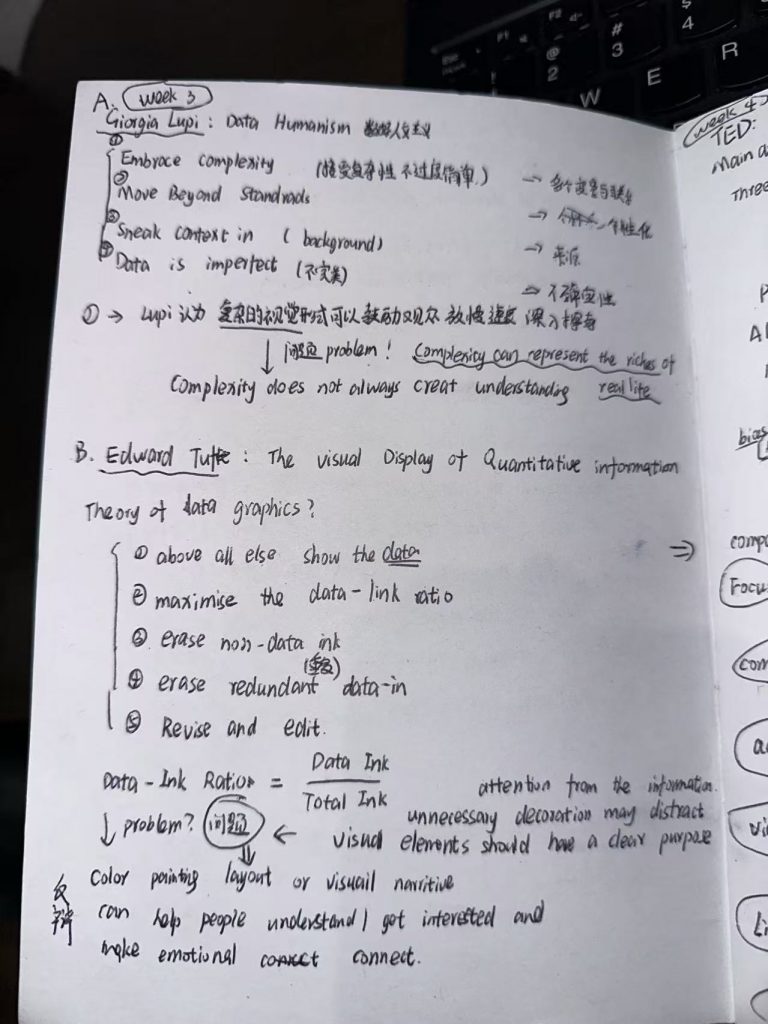
Tufte text: The Visual Display of Quantitative Information.
“ Data graphics should draw the viewer’s attention to the sense and substance of the data, not to something else. The data graphical form should present the quantitative contents. Occasionally artfulness of design makes a graphic worthy of the Museum of Modern Art, but essentially statistical graphics are
instruments to help people reason about quantitative information.”
Tufte — Data Ink, Redundancy and Visualisations
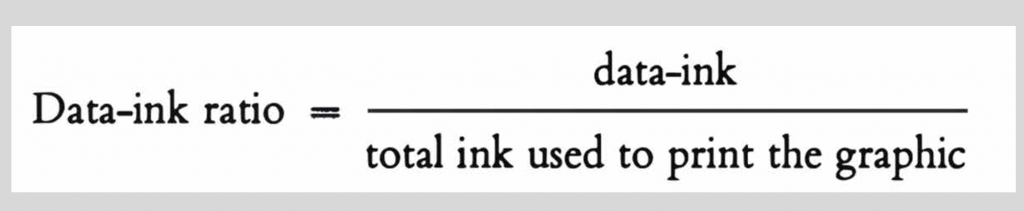
“ Above all else show the data.Maximize the data-ink ratio.Erase non-data-ink. Erase redundant data-ink. Revise and edit.
This analog, manual,and even imperfect way we approached data has opened the idea of data to a wider audience and made it more accessible, more understandable, and more easily relatable to people’s daily lives.Giorgia Lupi -Data Humanism in Practice – Dear Data
Giorgia Lupi and Kaki King –
Data Humanism in Practice -Bruises: The Data We Don’t See
“ Data represents real life. It is a snapshot of the world, in the same way that a picture catches a small moment in time.
Thursday 8 October
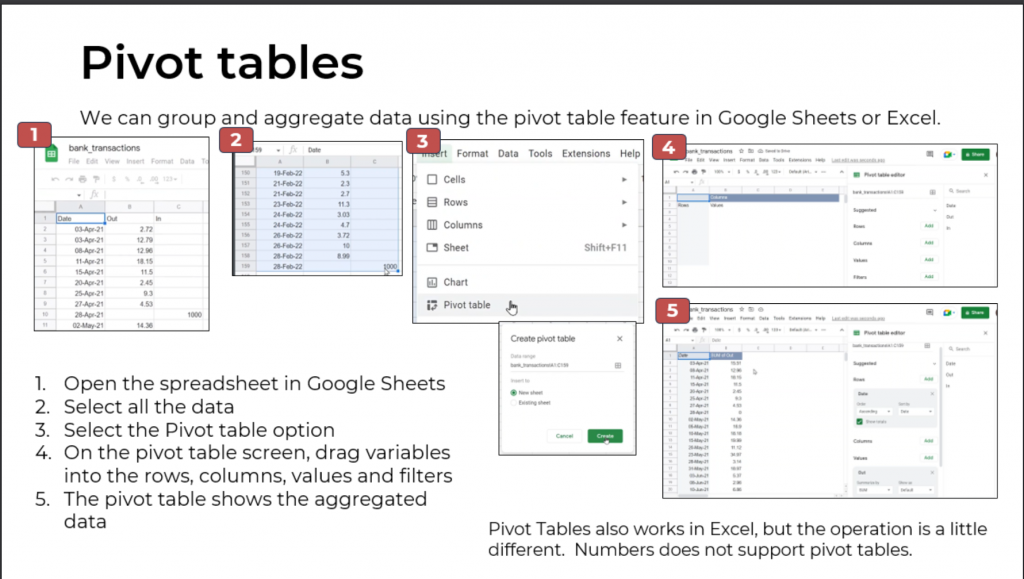
Visualisation Tools, Datasets and Data Stories
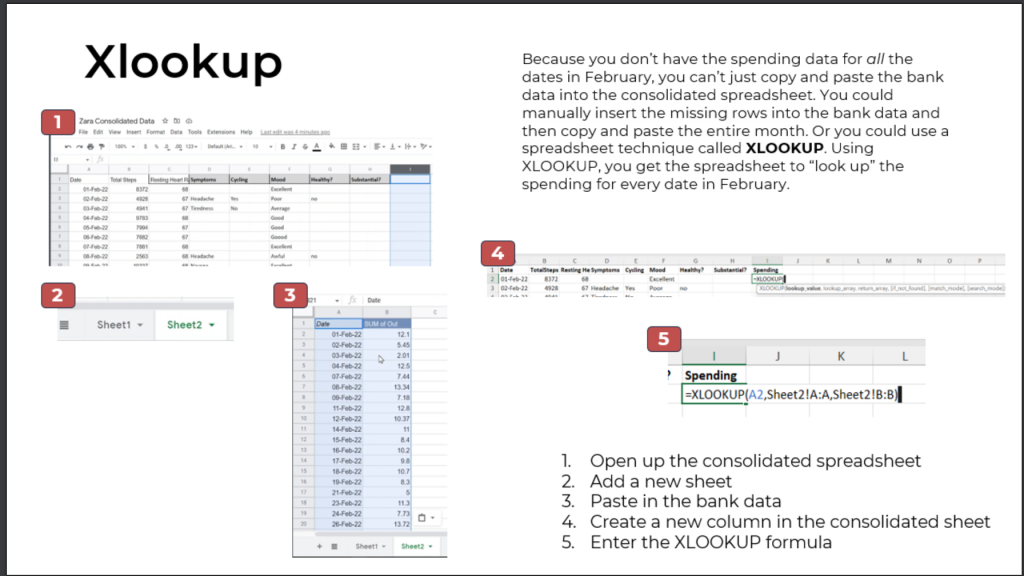
Learn how to create a pipeline in Excel, learn how to use pivot tables, and use the XLOOKUP function to verify data
Leave a Reply